Airbnb Analytics: The Data Stack Behind Pricing
What Airbnb analytics actually measures, the data pipeline behind every pricing tool and revenue calculator, and how to build your own on a live Airbnb API.
Every Airbnb pricing tool, revenue calculator, and market dashboard runs on the same thing: a data pipeline. Strip away the charts and that’s what you’re paying for.
Airbnb analytics turns raw listing data into the metrics that drive pricing and investment decisions — occupancy, ADR, RevPAR, comp-set benchmarks. AirROI, Mashvisor, and Rabbu sell it as a polished dashboard. This post shows what’s actually under the hood, and how to build the same stack yourself on a live Airbnb API.
What is Airbnb analytics, really?
Airbnb analytics is the discipline of converting public listing data into decision-grade metrics: how full a market runs, what it charges, and what a given listing should earn. The benchmarks are real and moving. As of January 2026, AirDNA put U.S. short-term-rental occupancy at 48.4%, average daily rate at $246.62, and RevPAR at $119.27 across roughly 1.68 million active listings.
Those three numbers — occupancy, ADR, RevPAR — are the spine of the whole field.
Everything a pricing tool tells you is some transformation of listing-level price and availability data, aggregated across a market and a time window. The dashboard is the easy part. The data pipeline feeding it is the hard part, and the part that decides whether the numbers are right.
Which metrics actually matter for Airbnb analytics?
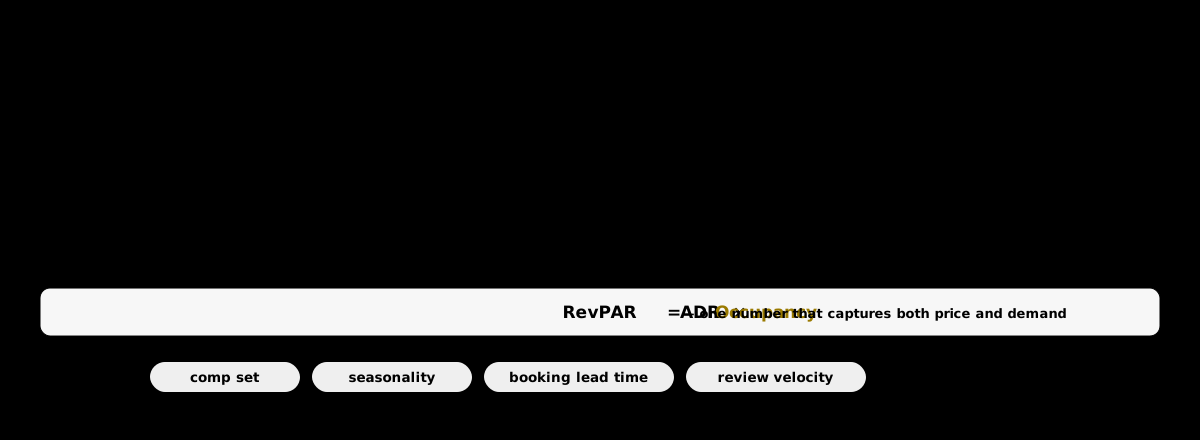
Three metrics carry most of the weight: ADR (average daily rate), occupancy (the share of available nights that get booked), and RevPAR, which multiplies them. RevPAR is the number to optimize because it captures price and demand in one figure — a listing can win on rate and still lose on revenue if it sits empty.
Around that core sit a few more that matter:
- Comp set — the basket of similar nearby listings you benchmark against.
- Seasonality — how ADR and occupancy swing across the calendar.
- Booking lead time — how far ahead guests reserve, which drives when you should adjust price.
- Review velocity — new reviews per month, a proxy for booking volume you can read directly.
ADR is easy to read off a listing. Occupancy is the hard one, because true bookings are private — you estimate it from how a listing’s calendar fills over time. Get the occupancy estimate wrong and every downstream number inherits the error.
What does the data stack behind Airbnb analytics look like?
The stack has four layers: ingest, store, model, and surface. You pull listing data through an API, land it in a warehouse, compute metrics on a schedule, then expose them in dashboards, alerts, or a pricing engine. Tools like AirROI and Mashvisor own all four layers; building your own means assembling them, with the API as the foundation.
Here’s each layer in plain terms:
- Ingest — pull search results and stay details from an Airbnb API, on a schedule, into raw tables.
- Store — land the JSON in a warehouse like BigQuery, Snowflake, or plain Postgres.
- Model — compute ADR, occupancy estimates, RevPAR, and comp-set rollups with scheduled queries.
- Surface — push the metrics into dashboards, threshold alerts, or a dynamic-pricing job.

The further left you go, the more it matters. A pretty dashboard on stale or thin data is worse than no dashboard, because it looks authoritative. Get ingestion right (fresh, complete, normalized) and the rest is SQL.
How do pricing tools and revenue calculators actually work?
A revenue calculator is a model over a comp set. It picks listings similar to yours by bedroom count, type, and location, reads each one’s price and availability, aggregates them — usually a median or a percentile band — and returns an estimated nightly rate or annual revenue. The math is simple. The accuracy lives entirely in comp-set quality and data freshness.
This is the part the AirDNA outlook and tools like Rabbu productize.
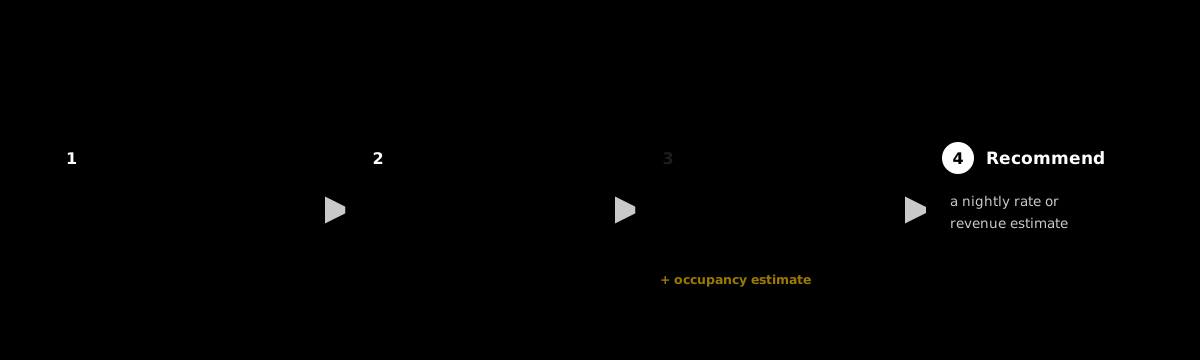
When you build it yourself, the loop is: define the comp set with a search query, pull each comp’s pricing and availability, estimate occupancy from the calendar, then roll up to a recommendation. The same pipeline that powers a dashboard powers a pricing engine — you’re just pointing the output at a different place.
Stale data is the silent killer here. A calculator running on a three-month-old snapshot will hand you a confident number that no longer reflects the market.
Should you build your own Airbnb analytics or buy a dashboard?
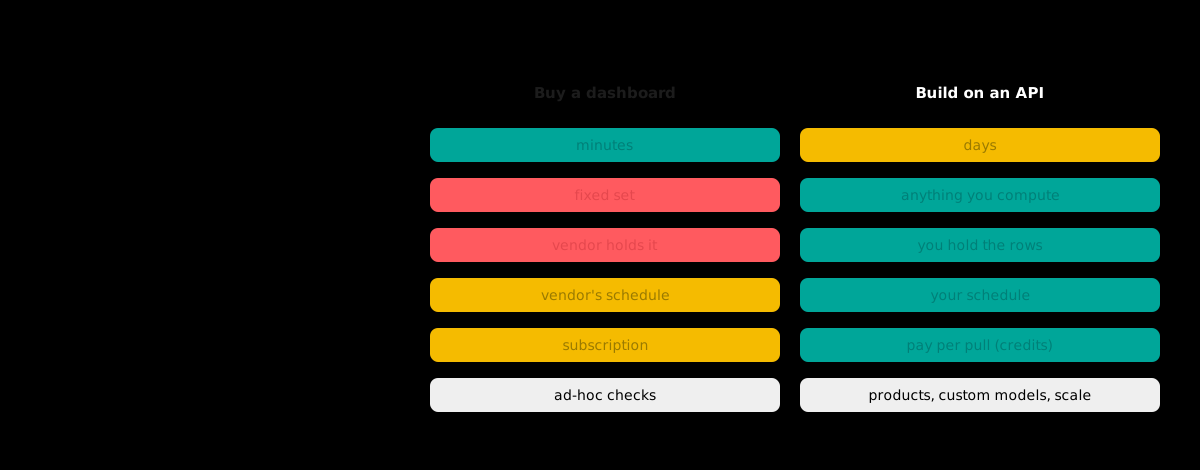
Buy a dashboard when speed matters and the built-in metrics fit your question. Build on a raw API when you need custom metrics, want to own the data, or are embedding analytics into your own product. The honest answer for most teams is both: a tool for quick lookups, a pipeline for the metrics that are actually your competitive edge.
| Buy a dashboard | Build on an API | |
|---|---|---|
| Tools | AirROI, Mashvisor, Rabbu | Staying API + your warehouse |
| Time to first insight | Minutes | Days |
| Custom metrics | Fixed set | Anything you can compute |
| Data ownership | Vendor holds it | You hold the raw rows |
| Freshness control | Vendor’s schedule | Your schedule |
| Cost model | Subscription | Pay per pull (credits) |
| Best for | Ad-hoc checks, single markets | Products, custom models, scale |
If analytics is your product — a pricing tool, an investor platform, an internal underwriting model — you don’t want to rent the data layer that defines it. That’s the case for building.
How much data does Airbnb analytics actually take?
Less than you’d think, because you only pull what you analyze. On Staying API, a search page costs 12 credits and each stay detail costs 1 credit. Profiling a 1,000-listing market is a few hundred search credits to enumerate it plus 1,000 detail credits to enrich it — comfortably inside the 5,000-credit annual plan, with sub-200ms responses.
A worked example for one market sweep:
- Enumerate ~1,000 listings: about 20 search pages at 12 credits each = ~240 credits.
- Enrich each with full detail (pricing, availability, reviews): 1,000 × 1 credit = 1,000 credits.
- Total: ~1,240 credits for a complete market snapshot you own outright.

Re-run that weekly and you have a time series — the raw material for occupancy estimates and seasonality, without a per-seat subscription. Use /v1/search to enumerate and /v1/stays/{id} to enrich, or POST /v1/search/with-details to do both in one call.
How to start building Airbnb analytics today
Pick one market and one question — say, “what should a two-bedroom in my city charge in August?” Enumerate the comp set with a dated search, enrich each listing, land the rows, and compute ADR and an occupancy estimate. That single loop is the whole stack in miniature; everything else is scale and polish.
You don’t need the full warehouse on day one. A search call, a detail call, and a spreadsheet will already beat a stale dashboard.
Grab an API key and pull your first market. 100 credits are free, which is enough to profile a small comp set and see the data behind the metrics for yourself.
Frequently asked questions
- What is Airbnb analytics?
- Airbnb analytics is the practice of turning raw listing data — prices, availability, reviews, attributes — into metrics that guide pricing and investment, like occupancy, average daily rate (ADR), and revenue per available rental (RevPAR). Tools like AirROI, Mashvisor, and Rabbu package it; underneath, every one of them runs a data pipeline over public listing data.
- What metrics matter most for Airbnb analytics?
- The core three are ADR (average daily rate), occupancy (share of available nights booked), and RevPAR, which multiplies the two. Around them sit comp-set benchmarks, seasonality curves, booking lead time, and review velocity. RevPAR is the single number most operators optimize because it captures both price and demand at once.
- How do Airbnb revenue calculators and pricing tools work?
- They build a comp set of similar nearby listings, read each one's price and availability, then aggregate — usually a median or percentile — to estimate what a unit should charge or earn. The output is only as good as the comp set and how fresh the underlying data is. Stale snapshots produce confident, wrong numbers.
- Should I build my own Airbnb analytics or use a tool like AirROI or Mashvisor?
- Buy a dashboard when you need answers fast and the built-in metrics fit. Build on a raw API when you need custom metrics, want to own the data, or are embedding analytics in your own product. Many teams do both: a dashboard for ad-hoc checks, a pipeline on a live API for the metrics that are their edge.
- Where does Airbnb analytics data come from?
- From the public Airbnb marketplace — listing pages with prices, calendars, reviews, and host details. Analytics tools collect it by scraping or through a third-party API. Airbnb's own Partner API is invite-only and doesn't expose marketplace data, so analytics products rely on the public surface.
- How much does it cost to pull Airbnb data for analytics?
- On Staying API, a search page costs 12 credits and each detail lookup costs 1 credit. Analyzing a 1,000-listing market is roughly a few hundred search credits plus 1,000 detail credits — well within the 5,000-credit annual plan. You only pay for what you pull, so cost scales with how deep you analyze.
Build it on real Airbnb data
Pull listings, photos, host info, reviews, availability, and pricing from one REST endpoint. 100 free credits, no credit card.